
Application of CABAS
The program was tested in the laboratories of all authors and was found to yield satisfactory results. We have fitted sample chromosomal data points and calculated the 95% confidence limits. Also the width of the 95% confidence interval was calculated for a given aberration frequency but for different numbers of scored cells. The results of the calculations are presented here.
The following data was used for testing the program:
|
Dose Dicentric Cells (Gy) number scored
0.0 1 2000 0.25 48 6883 0.5 119 4917 1.0 142 2366 2.0 105 462 3.0 242 494 5.0 234 173 8.0 301 89 |
The data is based on the results published by Edwards et al. (1979) who used a 60Co source to irradiate human peripheral blood lymphocytes at a dose rate of 0.5 Gy/min. We have added the value of 1 dicentric in 200 cells for the dose of 0 Gy. |
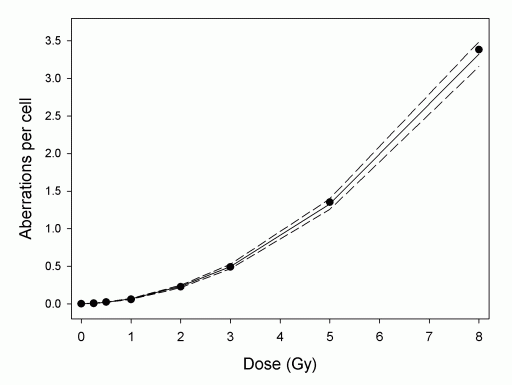
First we compared the width of the 95% CL on dose, generated on the basis of scoring low (1-10) and high (10-100) numbers of dicentrics. The results are presented in figure 1. When the absolute numbers of aberrations and scored cells are low, wider CL are obtained with method 2 than with method 1 (figure 4, panel A). This difference disappears when the numbers of aberrations and cells scored increase and, in fact, at aberration numbers above 70 (corresponding to a dose of 3.5 Gy on figure 4, panel B) the CL obtained with method 1 are slightly wider than those of method 2. Also, the CL calculated by method 1 are wider than those of method 1 in cases of a poor fit of the calibration curve to the data points.
 |
Dose response curve fitted by CABAS. Circles represent scored aberration frequencies, solid line - the fitted curve and dashed lines - the 95% confidence intervals. |
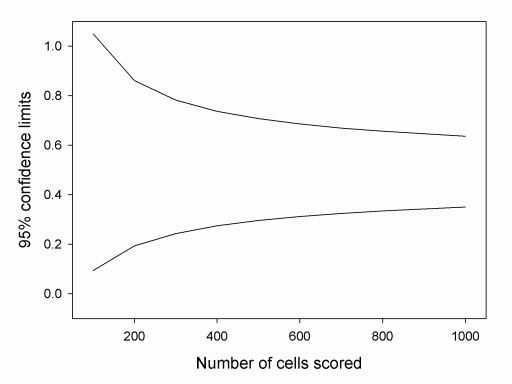
Next, we tested the MCELL module to calculate the confidence limits for a dose of 0.5 Gy. Increasing numbers of cells were use for the calculation. As expected, the confidence limits become narrower with increasing numbers of scored cells.
 |
Impact of the numbers of scored cells on the width of the 95% confidence interval of dose. Calculated for a dose of 0.5 Gy. |